
My Goal
In my home office, I decided to segregate my computers from the wireless network using an ethernet switch and a separate VLAN. This setup is pretty straightforward, as most managed switches have a web interface that allows easy configuration. I had a problem, though: I wanted to be able to monitor traffic flowing through the switch, and I wanted to do it for free. I also wanted the setup to be something easy to install and configure.
Port Mirroring
Although there is certainly more than one way to monitor a home network, I chose to use port mirroring. Port mirroring is a term used to describe the process of sending a copy of packets passing through one or more ports on the switch to another port on the same switch. This allows a computer attached to the mirror port to monitor and log traffic in and out of the VLAN.
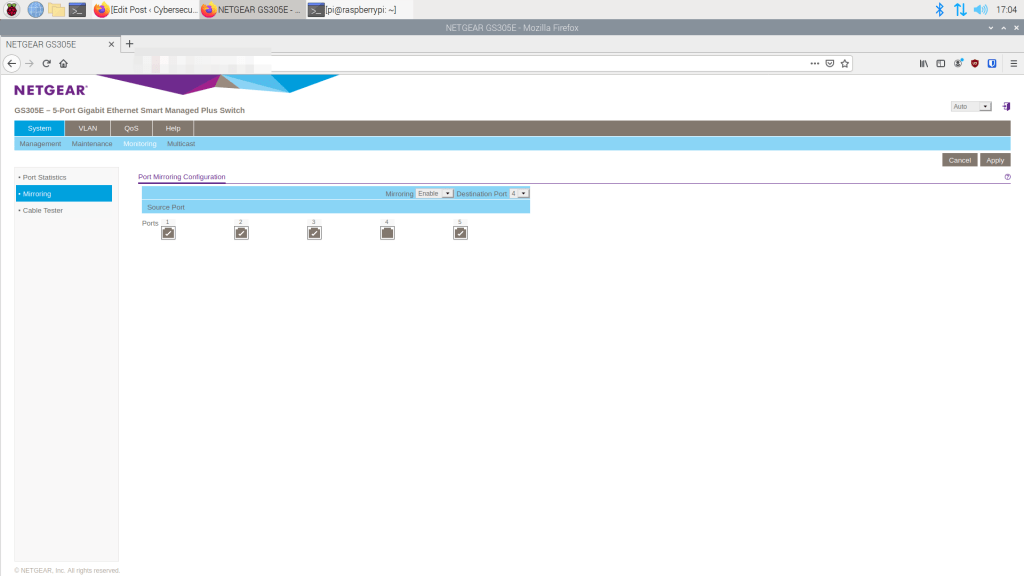
Setting up port mirroring on a switch is pretty simple on a home network. For a Netgear switch, login with the web management tool and select port mirroring. In this screenshot, port 4 is set up as the mirrored port:
Network Monitoring Tools
On the VLAN, I have both Linux and Windows computers. The system I have attached to the monitoring port is a Raspberry Pi 4 with 4GB RAM. Initially, I considered dedicating the system to only network monitoring by using software like Nagios Core. I also tried setting up Icinga2, another open-source network monitoring tool, on a laptop running Ubuntu 20.04. Both turned out to be time consuming to install and difficult to configure, so I set them aside for now. Instead, I decided to use easier to configure tools.
Wireshark
Wireshark is an open-source network protocol analyzer. Learning to use this tool is critical for anyone interested in security. It can be downloaded from https://www.wireshark.org. and works on Linux, Mac, and Windows. To use the tool you will need sudo or administrator privileges. On linux, just open the terminal and type
sudo wireshark
Here is a screenshot of a capture:

You can save the capture to a .pcap file for detailed analysis later.
HTOP And NTOP
The htop website, https://htop.dev, decribes htop as “a cross-platform interactive process viewer. ” It is launched from the Linux terminal. Install htop using the following commands:
sudo apt-get update
sudo apt-get install htop
To run htop, type
sudo htop
You get an output as follows:

Ntop is a little different. It is accessed via a web browser and has a GUI. Here is a link with intructions for installing ntop:
https://www.howtoforge.com/installing-and-configuring ntop
I found the process to be pretty easy compared to Icinga2 or Naggios. To access ntop via a browser, type http://localhost:3000. Be sure to change the default password. Ntop is a very functional traffic analysis tool:


TCPDUMP
Tcpdump is a packet analyzer for linux that is run from the command line. Like htop, it is installed from the command line with the commands
sudo apt-get update
sudo apt-get install tcpdump
According to Daniel Miessler, tcpdump can analyze traffic by “IP, port, protocol, or application.” He has a tutorial at https://danielmiessler.com/study/tcpdump/.
NMAP
Nmap is a network monitoring tool in that it is used for “network discovery and security auditing” (see https://nmap.org). For example, you can scan a device on your network to look for unintentionally open ports. Installing is simple, on the terminal, type
sudo apt-get update
sudo apt-get install nmap
To run, use the syntax
sudo nmap [IP Address]
You will get an output similar to this:
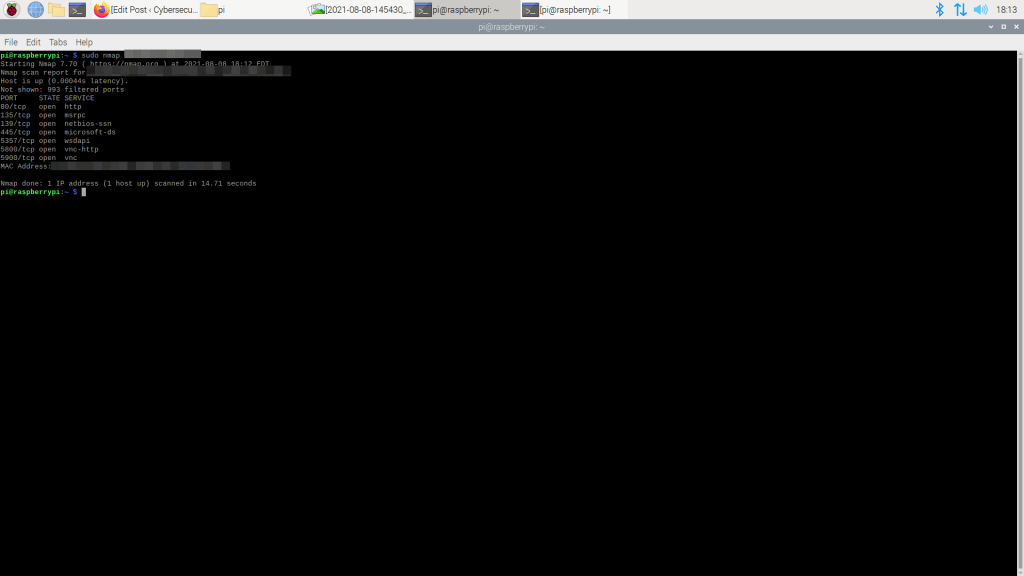
There is an excellent nmap cheat sheet with commands and switches at https://www.stationx.net/nmap-cheat/sheet.
Windows Network Monitoring
If you choose to use Windows for network monitoring, there is a tool called Microsoft Network Monitor. It can be downloaded from https://www.microsoft.com/en-us/download/details.aspx?id=4865. It is an archived tool, but it worked well for me on Windows 8.1 Pro. It gives you an output something like this:

Remember that Wireshark works great on Windows as well. Plus, you can also use sysinternals Process Monitor and Tcpview as well. Both are available for free at https://docs.microsoft.com/en-us/sysinternals/downloads/.
This post probably just scratches the surface of what can be done with these and other network monitoring tools. Check out the websites for the individual tools to learn as much as you can about their uses.
